

Every generation is told it has it harder than the last, and every generation is partly right and partly wrong. What is different now is that we can check.
The federal statistical agencies survey American young people constantly. The Centers for Disease Control and Prevention asks high school students about their health and safety every two years. The National Center for Education Statistics tracks who finishes school and who is bullied in it. The Bureau of Labor Statistics counts who has a summer job. Monitoring the Future has asked 12th graders about drugs and alcohol every year since 1975, and 8th and 10th graders since 1991.
So this is a list of eleven issues facing our youth today, and for each one, the number a public agency actually published, with the year attached. Some are worse than you would guess. Several are considerably better. Where the data does not support a claim, that claim is not in this article.
A note on what these numbers are. Most come from surveys of students in school, which means they miss young people who are not in school. Most are national averages, which flatten enormous variation between places. And a survey that asks young people to describe their own feelings measures reported experience, not diagnosis. These are the best figures available, not perfect ones.
1. Leaving school without finishing

The share of young people who leave education without a high school credential has fallen, and it has fallen a long way.
The National Center for Education Statistics tracks what it calls the status dropout rate: the percentage of 16 to 24 year olds who are not enrolled in school and have not earned a high school diploma or an equivalent credential such as a GED. In 2022 that rate was 5.3 percent, down from 7.0 percent in 2012.
The proportion is small and the absolute number is not. NCES counted roughly 2.1 million status dropouts aged 16 to 24 in 2022. Over that decade NCES reports a decline for five groups: American Indian and Alaska Native young people, at 9.9 percent in 2022, Hispanic at 7.9 percent, Black at 5.7 percent, White at 4.3 percent and Asian at 1.9 percent. For Pacific Islander students, at 9.1 percent, and for students of some other race, NCES reports no measurable change since 2012.
This is the entry most likely to surprise a reader who remembers the dropout panic of the 2000s. Fewer young people are leaving school early than at almost any point on record. (NCES, Condition of Education: Status Dropout Rates)
2. Reading and math scores that have not come back
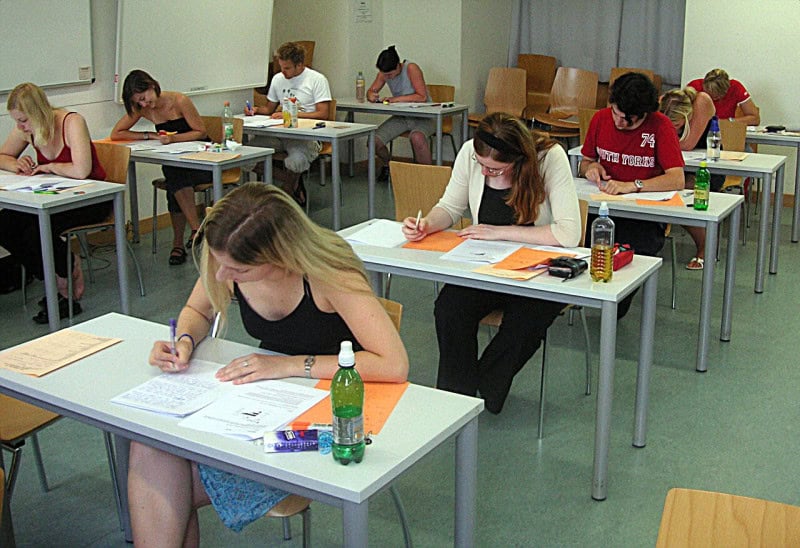
Finishing school is not the same as learning in it, and the second measure has moved the other way.
The National Assessment of Educational Progress, usually called the Nation’s Report Card, tests a national sample of students every two years. In 2024, the average eighth-grade reading score was 2 points lower than in 2022 and 5 points lower than in 2019. Eighth-grade math was flat against 2022 and 8 points below 2019.
Flat math is not reassurance. It holds a level reached after what the National Assessment Governing Board calls a historic 8-point drop between 2019 and 2022.
The distribution matters more than the average. About a third of eighth graders scored below the NAEP Basic benchmark in reading in 2024, which the governing board describes as a greater percentage than ever before, and it reports that gaps are growing between higher-performing and lower-performing students. The average is being held up by students who were already doing well. The people who watch that gap widen from the front of a classroom are teachers, and if you have ever wanted to say something to one of them, that is a separate list. (NAGB, 10 Takeaways from the 2024 NAEP Results, for the two characterisations quoted; the point changes are from the 2024 NAEP results themselves, published on the Nation’s Report Card)
3. Bullying, and the part of it that follows them home

In the 2021 to 2022 school year, about 19 percent of students aged 12 to 18 reported being bullied at school, according to the School Crime Supplement to the National Crime Victimization Survey, collected for NCES. That is down from 28 percent in 2010 to 2011.
One detail inside that figure is worth more than the headline. Among students who were bullied, 22 percent said some of it happened online or by text. The bullying that follows a young person home is a minority of the total, and it is the minority that never stops at the school gate.
The CDC’s separate survey of high school students disagrees about direction over a shorter window. In its national Youth Risk Behavior Survey, the share of students bullied at school rose from 15 percent in 2021 to 19 percent in 2023. The two surveys ask different populations in different years and are not directly comparable, which is a reason to treat any single bullying number carefully rather than a reason to pick the scarier one. (NCES, Student Bullying · CDC, 2023 YRBS Results)
4. Social media: constant use, measured harms, and what young people say
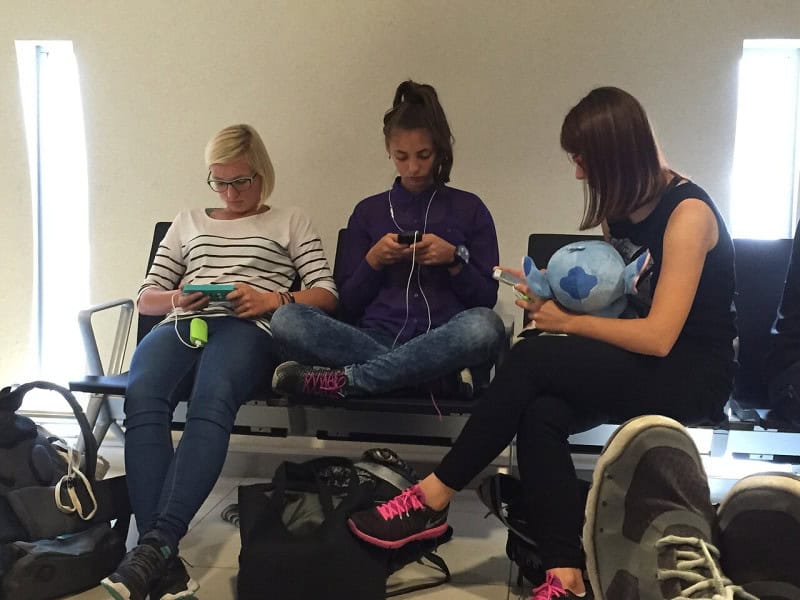
The change here is not that young people use social media. It is that the usage has no edges, and that they have a clearer view of it than the argument about them usually allows.
Pew Research Center reports that 40 percent of US teens say they are online almost constantly, up from 24 percent in 2014 to 2015, and slightly down from 46 percent the year before. In its 2025 survey, about one in five said this of TikTok and YouTube. The CDC’s 2023 Youth Risk Behavior Survey found 77.0 percent of high school students reporting frequent social media use, and reports that frequent use was associated with a higher prevalence of being bullied, of persistent sadness or hopelessness, and of suicide risk. Association is not cause, and the CDC does not claim it is.
Then there is what they say about it themselves, which is the strangest set of numbers here. Pew surveyed US teens in late 2024 and published in April 2025. 48 percent said social media has a mostly negative effect on people their age, up from 32 percent in 2022. Only 14 percent said it has a mostly negative effect on them personally, up from 9 percent. That gap, roughly three to one between what they believe about their peers and what they report about themselves, is the most interesting single figure in this article. 45 percent also said they spend too much time on social media, up from 36 percent in 2022.
The reported harms are not evenly distributed. Girls were more likely than boys to say social media had hurt their mental health (25 percent against 14 percent), their confidence (20 percent against 10 percent) and their sleep (50 percent against 40 percent).
One thing worth holding on to is how recent all of this is. Earlier generations argued about images too, but those images stayed put: the most famous of them hung on a wall you had to travel to see. (Pew, Teens, Social Media and AI Chatbots 2025 · Pew, Teens, Social Media and Mental Health · CDC MMWR, YRBS 2023)
5. Persistent sadness and hopelessness
The CDC asks high school students whether they felt so sad or hopeless almost every day for two weeks or more in a row that they stopped doing some usual activities. It is a single survey question about reported experience, not a clinical diagnosis, and it is widely cited as a measure of adolescent mental health in the United States.
In the 2023 national Youth Risk Behavior Survey, 40 percent of high school students reported persistent feelings of sadness or hopelessness, down from 42 percent in 2021.
The figure is much higher among female students, and it also fell: 53 percent in 2023, down from 57 percent in 2021. The CDC reports that over the same period the share of female students who seriously considered attempting suicide fell from 30 percent to 27 percent. (CDC, 2023 YRBS Results)
6. Not feeling safe at school
This is the CDC measure that moved the wrong way between its 2021 and 2023 surveys, and it moved on both limbs.
The share of high school students who were threatened or injured with a weapon at school rose from 7 percent in 2021 to 9 percent in 2023. The share who missed school because they felt unsafe, either at school or on the way there, rose from 9 percent to 13 percent.
The second number is the one with consequences attached to it. More than one student in eight reported losing school days to a safety worry. (CDC, 2023 YRBS Results)
7. Substance use, and the thing most people get wrong

The longest-running survey on young people’s drug and alcohol use finds it near historic lows, and has done for five consecutive years.
Monitoring the Future has surveyed 12th graders every year since 1975, and 8th and 10th graders since 1991. It is run by the University of Michigan and funded by the National Institute on Drug Abuse. In the 2025 survey, 91 percent of 8th graders, 82 percent of 10th graders and 66 percent of 12th graders reported abstaining from marijuana, alcohol and nicotine altogether in the previous 30 days.
Among 12th graders in 2025, about 41 percent reported using alcohol in the previous 12 months and 26 percent reported using marijuana.
The researchers describe substance use in this age group as remaining near historic lows for a fifth consecutive year, and abstention as being at record levels. That is a report of what the survey found, and it describes a population rather than any individual. (Monitoring the Future, national survey results 1975 to 2025)
8. Weight, measured rather than reported
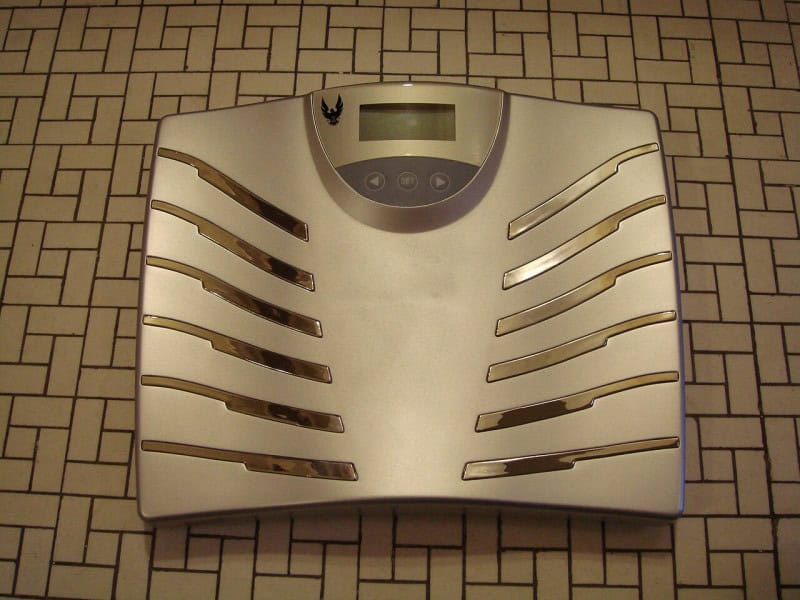
Most numbers in this article come from asking young people questions. This one comes from weighing and measuring them, which is why it is worth separating.
The National Health and Nutrition Examination Survey takes measured heights and weights from a national sample. In the August 2021 to August 2023 cycle, 21.1 percent of Americans aged 2 to 19 had obesity, including 7.0 percent with severe obesity, and a further 15.1 percent were overweight.
The long trend is the story. Obesity in that age group has risen from 13.9 percent in 1999 to 2000 to 21.1 percent, and severe obesity from 3.6 percent to 7.0 percent over the same period.
These are population prevalence figures from a measurement survey. They describe a group and say nothing about any individual, and body mass index is a screening measure rather than a diagnosis. (NCHS Health E-Stat, NHANES)
9. Growing up without enough money

The official poverty rate for children under 18 was 14.3 percent in 2024, down from 15.3 percent in 2023, according to the Census Bureau.
Poverty is measured more than one way in the United States and the ways disagree. The Supplemental Poverty Measure, which counts tax credits and non-cash benefits such as food assistance and subtracts costs such as out-of-pocket medical spending, produces a different figure for children, and it is the measure currently in flux: the Bureau of Labor Statistics re-released its Supplemental Poverty Measure thresholds for 2019 to 2024 in July 2026 after finding coding errors, and revised rates followed. Anyone comparing child poverty figures across sources should check which measure and which vintage they are reading.
On the Supplemental Poverty Measure, child poverty has not returned to the level it reached in 2021, the year the expanded Child Tax Credit was in effect. On the official measure it has. (Census, Poverty in the United States: 2024 · Census statement on the Supplemental Poverty Measure)
10. Getting a first job

The summer job is the entry point to the labor market, and the Bureau of Labor Statistics counts it every July.
In July 2026, the unemployment rate for 16 to 24 year olds was 9.1 percent, down from 10.8 percent in July 2025. There were 21.3 million employed 16 to 24 year olds.
The unemployment rate is only half the picture, and the other half is flatter. The share of young people actually in work, the employment to population ratio, was 53.8 percent in July 2026, which BLS describes as little changed from 53.1 percent in July 2025, itself down from 54.5 percent in July 2024. Fewer young people looking for work were failing to find it, and the proportion holding a job barely moved. One good summer is not a trend either way. (BLS, Employment and Unemployment Among Youth)
11. Leaving home later, and what that costs
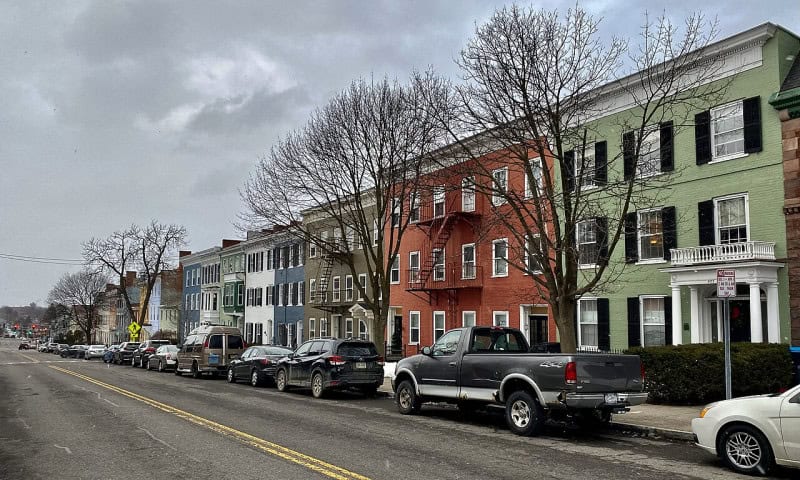
The last issue on this list arrives after school ends, and it is now common enough to be unremarkable.
The Federal Reserve’s Survey of Household Economics and Decisionmaking found that 49 percent of adults under 30 lived with a parent in 2025, up 6 percentage points since 2022 and 12 points since 2019. Among the youngest slice the share is higher: Pew Research Center, reporting in January 2024 on Census data, put 57 percent of adults aged 18 to 24 living with their parents, against 53 percent in 1993.
Living at home is not the same as being supported at home. Pew found that among young adults living with a parent, 65 percent pay for household expenses such as groceries or utility bills and 46 percent contribute to rent or a mortgage.
Whatever the cause, an arrangement that was once read as a sign of something having gone wrong is now the majority experience of American 18 to 24 year olds. (Federal Reserve, SHED 2025: Living Arrangements and Care Work · Pew, Parents, Young Adult Children and the Transition to Adulthood)
What the eleven add up to
Read them together and the picture is not the one either optimists or pessimists are selling.
Three things are clearly better than they were a decade ago: fewer young people leave school without a credential, bullying at school is well below its 2010 to 2011 level on the longer-running survey, and substance use sits near historic lows, where it has been for five consecutive years. A fourth improved over a shorter window: persistent sadness and hopelessness fell between 2021 and 2023, on the overall figure and on the much higher figure for female students. Three are clearly worse: measured obesity keeps rising, eighth-grade reading and math have not recovered to their 2019 levels, and more students are missing school because they feel unsafe. Several are simply unresolved, including the biggest argument of all, which is what an always-on social media environment does to the people inside it.
The most useful habit when reading any claim about young people is the one this article has tried to model. Ask who counted, in what year, and whether they were measuring or asking. If the group you work with needs something lighter than a discussion of these problems, the indoor youth group games on this site are written for the same age and the same rooms.
Sources
Every figure in this article comes from one of the following. Each is the page or report carrying the number quoted, not a landing page.
- NCES, Condition of Education: Status Dropout Rates (entry 1)
- National Assessment Governing Board, 10 Takeaways from the 2024 NAEP Results (entry 2)
- NCES, Student Bullying (School Crime Supplement to the NCVS) (entry 3)
- CDC, 2023 Youth Risk Behavior Survey Results (entries 3, 5 and 6)
- CDC, MMWR Supplement 73(4), Youth Risk Behavior Survey 2023 (entry 4)
- Pew Research Center, Teens, Social Media and AI Chatbots 2025 (entry 4)
- Pew Research Center, Teens, Social Media and Mental Health (entry 4)
- Monitoring the Future, University of Michigan (intro and entry 7)
- Monitoring the Future, national survey results on drug use 1975 to 2025 (PDF) (entry 7)
- NCHS Health E-Stat, NHANES August 2021 to August 2023 (entry 8)
- US Census Bureau, Poverty in the United States: 2024 (entry 9)
- US Census Bureau, statement on the Supplemental Poverty Measure (entry 9)
- Bureau of Labor Statistics, Employment and Unemployment Among Youth (entry 10)
- Federal Reserve, SHED 2025: Living Arrangements and Care Work (entry 11)
- Pew Research Center, Parents, Young Adult Children and the Transition to Adulthood (entry 11)
Image credits
Empty classroom by Dobrislava, CC BY-SA 4.0. Young people on smartphones by Chris Olszewski, CC BY-SA 4.0. High school corridor by Matt Dempsey, CC BY-SA 2.0. Skatepark by Andrew Parodi, CC BY-SA 3.0. Bathroom scale by D.L., CC BY-SA 2.0. Row houses in Geneva, New York by Andre Carrotflower, CC BY-SA 4.0. All via Wikimedia Commons. Students taking an exam, public domain. Cafe staff by Tim Wright, CC0.